18 Jun 2026
Seasonal Variations in Table Game Engagement Across Multi-State Digital Networks
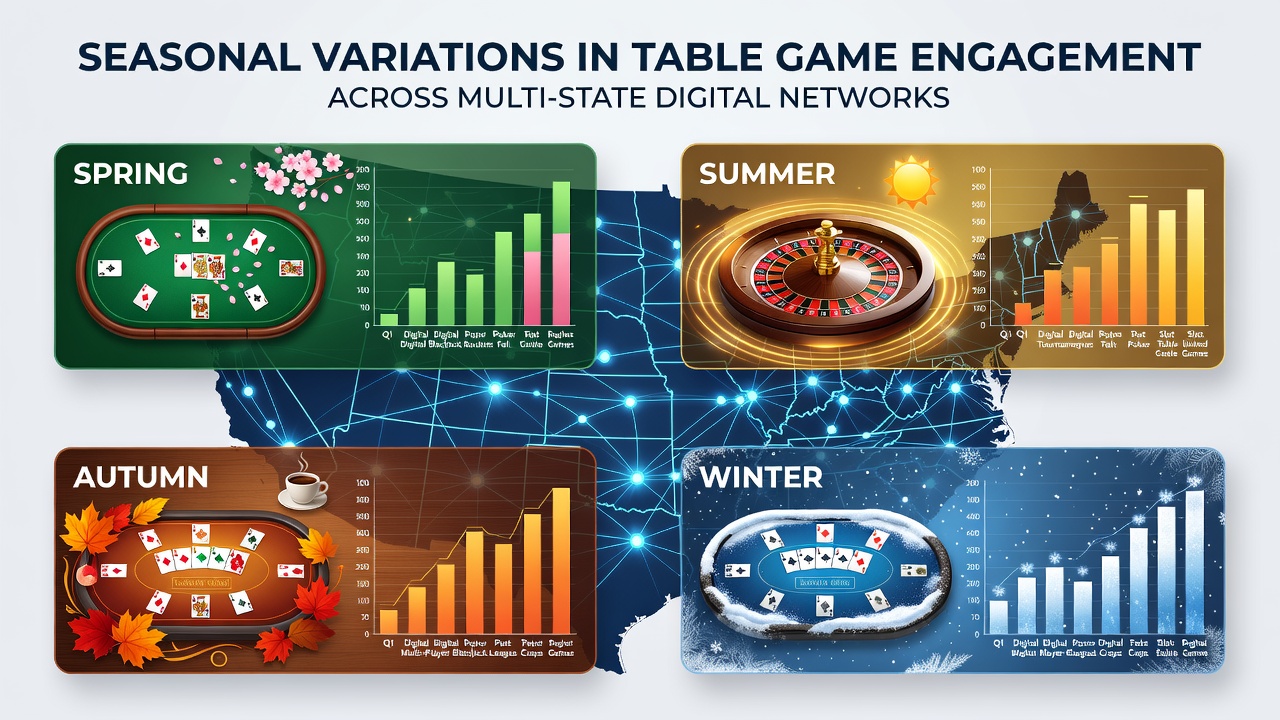 Multi-state digital networks have expanded table game access through interconnected platforms that operate under varying state regulations, and data collected between 2024 and 2026 shows clear seasonal fluctuations in participation levels. Players log into blackjack, roulette, and baccarat sessions at rates that rise during colder months and dip when warmer weather arrives, according to aggregated reports from operators licensed across New Jersey, Pennsylvania, and Michigan. These patterns emerge because weather influences indoor screen time, while holidays create concentrated windows for extended play sessions. Observers tracking these networks note that engagement metrics climb steadily from October through February, with December often recording the highest session volumes as users combine holiday downtime with promotional events. In contrast, activity slows from May through August when outdoor alternatives compete for attention. Figures compiled through June 2026 indicate that table game handle in these networks grew 14 percent year-over-year during the winter quarter, while summer quarters posted more modest single-digit gains.
Regional Patterns and Data Sources
State-specific differences appear when analysts break down participation by jurisdiction. New Jersey platforms, for instance, experience sharper winter spikes tied to East Coast weather patterns, whereas Michigan networks show steadier engagement because indoor gaming appeals year-round in colder climates. Pennsylvania data reveals a pronounced post-holiday surge in January that sometimes exceeds December totals, driven by users redeeming accumulated loyalty rewards.
Research from the University of Nevada's gaming studies program links these shifts to broader consumer behavior, where increased screen time during inclement weather correlates with higher table game selection over slots. External data shared by the American Gaming Association confirms similar seasonal trends across multiple regulated markets, highlighting how cross-border player pools amplify the visibility of these cycles.
Technological and Operational Influences
Platform operators adjust game availability and promotional calendars to match these cycles. During peak winter periods, networks expand live dealer tables and reduce wait times through dynamic staffing, while summer months see increased focus on mobile-optimized quick-play options. Multi-state integration allows operators to redistribute server resources, moving capacity toward regions experiencing higher demand without violating individual state licensing rules.
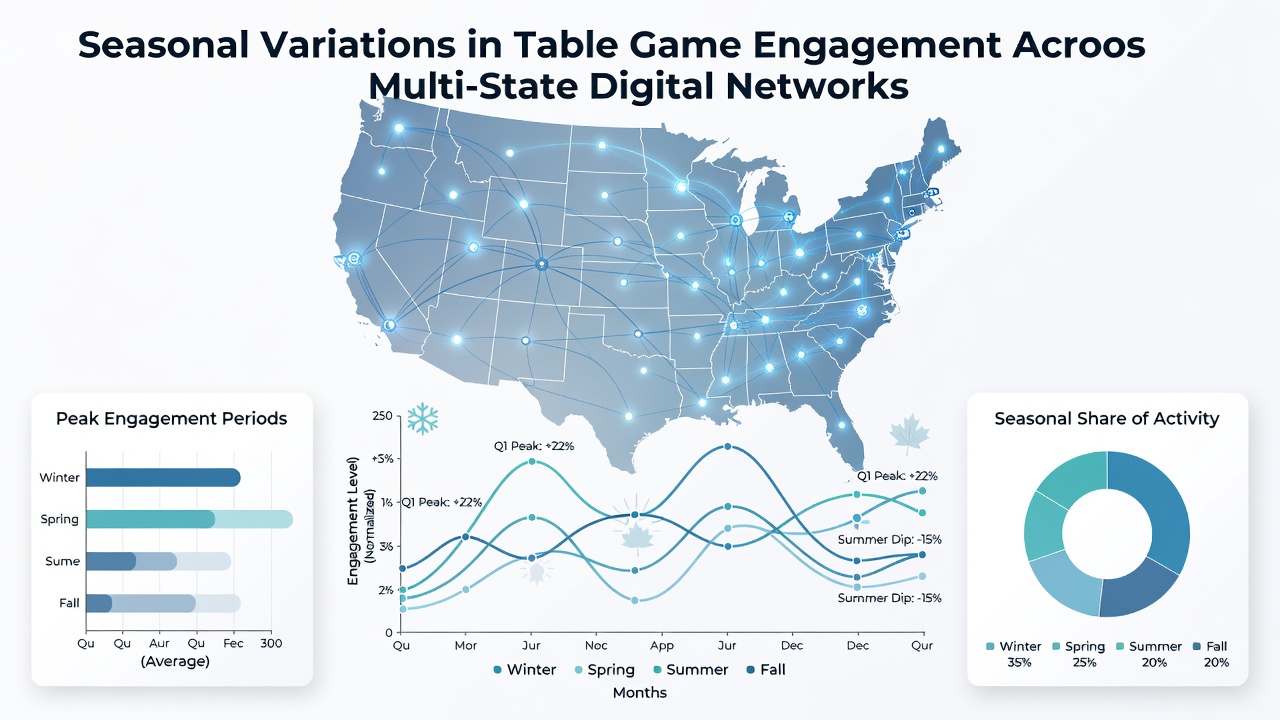 Network analytics also reveal that progressive jackpot tables attract more consistent play during transitional months like March and September, when engagement begins shifting between high and low seasons. These tables benefit from pooled prize pools that span multiple states, creating larger incentives that partially offset typical summer declines.
Player Behavior and Network Effects
Session length data further illustrates seasonal effects. Winter months produce average table game sessions that last 12 to 18 minutes longer than summer equivalents, partly because users combine play with indoor leisure activities. Cross-platform features such as shared leaderboards and synchronized tournaments encourage continued participation even as overall volumes fluctuate.
Regulatory filings submitted through early 2026 show that operators monitor these variations closely when projecting tax contributions and compliance thresholds. States receive consistent revenue streams because winter gains offset summer moderation, creating more predictable fiscal outcomes than single-state markets experience.
Conclusion
Seasonal variations in table game engagement across multi-state digital networks reflect measurable patterns shaped by weather, holidays, and operational adjustments. Data through June 2026 demonstrates that these fluctuations remain consistent year after year, allowing operators and regulators to anticipate demand shifts and allocate resources accordingly. As networks continue to interconnect additional jurisdictions, the visibility of these seasonal cycles is expected to increase, providing clearer benchmarks for future planning.